Run a Benchmark
- Install GuideLLM
- You can run GuideLLM two ways:
- Targeting a running OpenAI-compatible LLM server
- The most common setup.
- Using the vLLM Python backend, with vLLM running in the same process
- Requires knowledge on how to setup vLLM in addition to the knowledge on how to run GuideLLM.
- Simplifies orchestration due to the lack of need for a separate server.
[!NOTE]\ Everything in this guide applies to both backends except the backend-specific inputs.
This guide assumes you're using the OpenAI HTTP backend with an OpenAI-compatible LLM server. For information on using the vLLM Python backend see vLLM Python backend
After starting a server, you're ready to run benchmarks to evaluate your LLM deployment's performance.
CLI option format
The GuideLLM CLI provides options using a common registry-backed format. The registered implementation is selected with kind=<type> and parametrs are configured with key=value pairs:
Use comma-separated key=value pairs for flat settings (for example, --data kind=synthetic_text,prompt_tokens=256,output_tokens=128). Use serialized JSON or YAML when any value is nested (for example, --data '{"kind":"huggingface","source":"org/dataset","loader_kwargs":{"split":"test"}}'). Do not mix inline key=value and JSON/YAML in the same option. Some options can be repeated to supply multiple values (for example, multiple --data or --constraint entries).
You can load a saved scenario (YAML or JSON file) with --config (alias --scenario, -c). CLI options override scenario values.
Basic Example
To run a benchmark against your local vLLM server with default settings:
guidellm run \
  --backend kind=openai_http,target=http://localhost:8000 \
  --data kind=synthetic_text,prompt_tokens=256,output_tokens=128 \
  --constraint kind=max_duration,seconds=60
This command:
- Connects to your vLLM server running at
http://localhost:8000 - Uses synthetic data with 256 prompt tokens and 128 output tokens per request
- Automatically determines the available model on the server
- Runs a
sweepprofile (default) to find optimal performance points - Stops each strategy after 60 seconds
During the benchmark, you'll see a progress display similar to this:
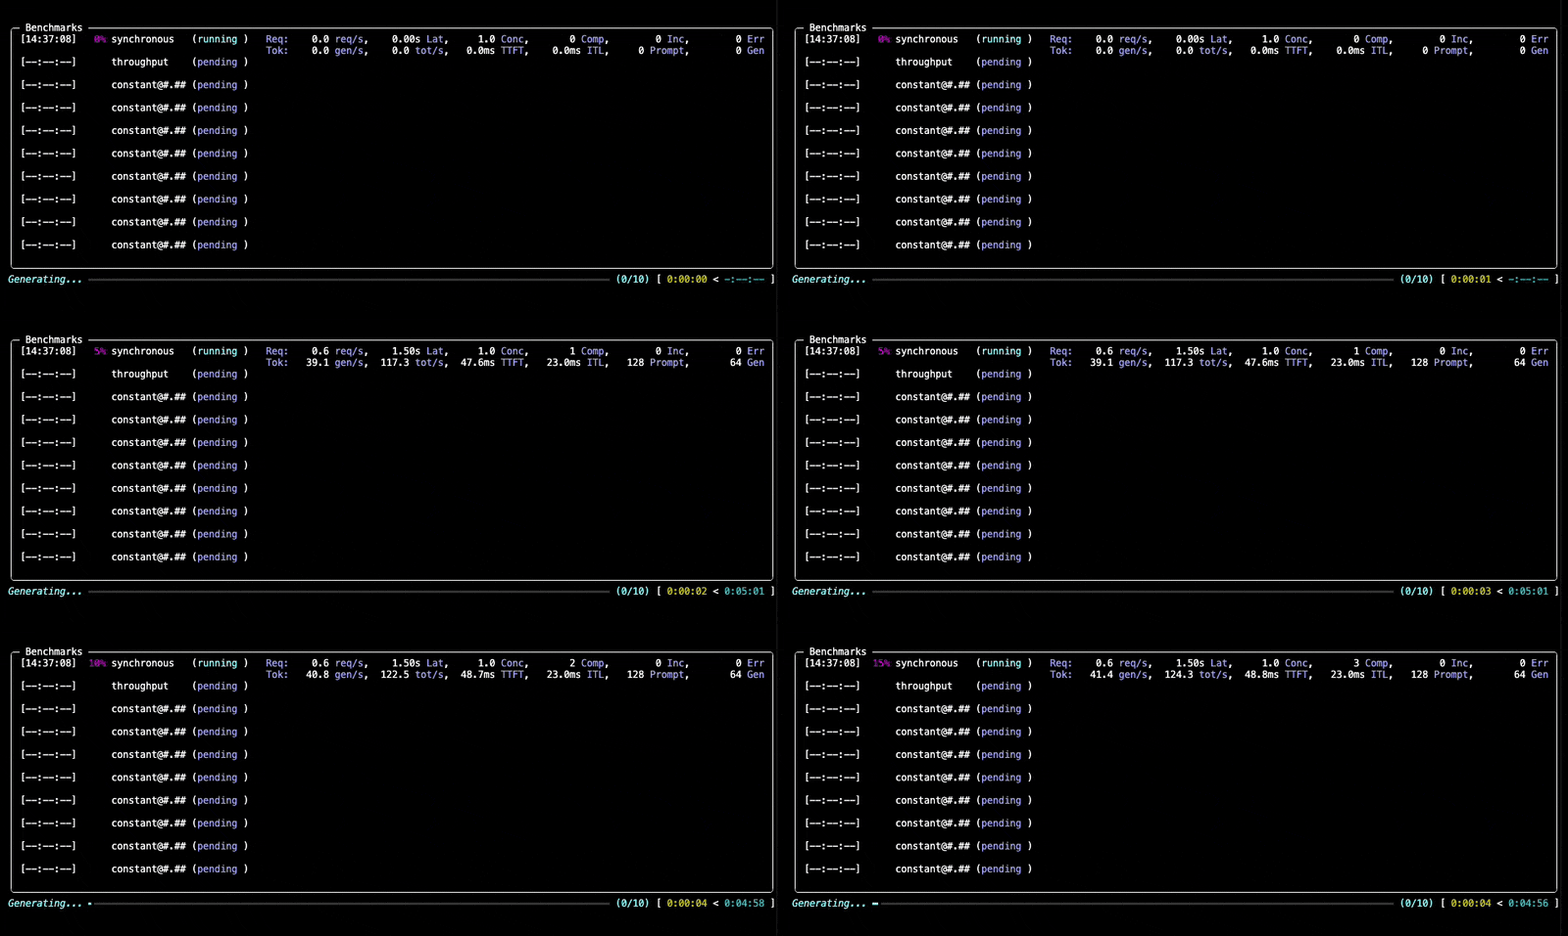
Learn more about dataset options in the Datasets documentation and backend configuration in the Backends documentation.
Understanding Benchmark Options
GuideLLM offers a wide range of configuration options to customize your benchmarks. Here are the most important parameters you should know:
Key Parameters
| Parameter | Description | Example |
|---|---|---|
--backend | Backend type and connection settings | --backend kind=openai_http,target=http://localhost:8000,model=Meta-Llama-3.1-8B-Instruct |
--data | Data type and configuration | --data kind=synthetic_text,prompt_tokens=256,output_tokens=128 |
--profile | Benchmark profile type and parameters | --profile kind=sweep,sweep_size=10 |
--constraint | Execution limits (repeatable) | --constraint kind=max_requests,count=1000 |
--seed | Random seed for reproducibility | --seed kind=static,value=42 |
--data-loader | Sample count and loader settings | --data-loader kind=pytorch,samples=1000 |
--output | Output format and path (repeatable) | --output kind=json,path=results/benchmark.json |
--tokenizer | Tokenizer for token counting | --tokenizer kind=huggingface_auto,model=gpt2 |
Random seed (--seed)
The random seed is used for any operation in GuideLLM that involves randomness, such as synthetic data generation or Poisson strategy scheduling. By default it is a fixed value, so rerunning GuideLLM with the same arguments should produce the same results:
Constraints (--constraint)
Constraints control when each strategy in a profile stops. Add one or more --constraint options. Constraints apply individually to each strategy in a profile. Profiles with multiple strategies include sweep and any profile whose primary parameter is a list (for example, {"streams":[10,20]} on concurrent).
| Constraint type | Config parameter | Example |
|---|---|---|
max_duration | max_duration (seconds) | --constraint kind=max_duration,seconds=30 |
max_requests | max_num | --constraint kind=max_requests,count=1000 |
min_requests | count | --constraint kind=min_requests,count=1000 |
max_errors | max_errors | --constraint kind=max_errors,count=10 |
max_error_rate | max_error_rate | --constraint kind=max_error_rate,rate=0.05 |
max_global_error_rate | max_global_error_rate | --constraint kind=max_global_error_rate,rate=0.05 |
over_saturation | detection parameters | --constraint kind=over_saturation,min_seconds=30,mode=enforce |
For example, --constraint kind=max_requests,count=1000 with --profile kind=sweep runs up to 1000 requests for each strategy in the sweep (synchronous, throughput, and each interpolated rate). --constraint kind=min_requests,count=1000 is like max_requests, but keeps queuing until 1000 requests have been processed, which avoids throughput tail-off at the end of rate-based benchmarks. --constraint kind=max_duration,seconds=30 with --profile '{"kind":"concurrent","streams":[10,20]}' runs 10 concurrent streams for 30 seconds, then 20 concurrent streams for 30 seconds.
See Over-Saturation Stopping for over-saturation constraint details.
Sub-benchmark (per-strategy) Constraints
When you use the sweep profile, or specify multiple rate values in the async/constant/poisson profiles, or multiple streams values in the concurrent profile, you are running multiple "benchmark strategies" within the profile. GuideLLM allows you to specify distinct control parameters for your constraints using the --override option. For example, --profile kind=sweep,sweep_size=5 --constraint kind=max_duration,seconds=30 runs 5 strategies (synchronous, throughput, and three interpolated constant rates) for 30 seconds each. You can use --override constraint[0].seconds 10,20,10,15,20 to run the synchronous strategy for 10 seconds, the throughput strategy for 20 seconds, and the three interpolated constant rates for 10 seconds, 15 seconds, and 20 seconds. Note that specifying fewer values, e.g. --override constraint[0].seconds 10,20,10, will reuse the final value of 10 seconds for all three constant strategies.
Benchmark Profiles (--profile)
GuideLLM supports several benchmark profiles, which are described in detail below. Profile-specific parameters go in the same configuration string after kind=<type>.
Synchronous Profile
Runs requests one at a time (sequential).
| Profile parameter | Description | Example |
|---|---|---|
| — | No rate parameter |
Throughput Profile
Attempts to discover the server's maximum throughput by continually making requests in parallel.
| Profile parameter | Description | Example |
|---|---|---|
max_concurrency | Number of concurrent request streams | --profile kind=throughput,max_concurrency=10 |
rampup_duration | Seconds to ramp up to maximum throughput | --profile kind=throughput,max_concurrency=10,rampup_duration=10 |
Concurrent Profile
Runs a fixed number of parallel request streams.
| Profile parameter | Description | Example |
|---|---|---|
streams | Concurrent streams to maintain; may be a list | --profile kind=concurrent,streams=10 or --profile '{"kind":"concurrent","streams":[16,32]}' |
rampup_duration | Seconds to spread initial requests | --profile kind=concurrent,streams=10,rampup_duration=10 |
max_concurrency | Maximum concurrent requests to schedule | --profile kind=concurrent,streams=10,max_concurrency=10 |
You can use the --override option to specify a list of stream values, to run a set of concurrent "strategies" (sub-benchmarks) with different stream values. For example, --profile kind=concurrent --override profile.streams 10,20,30 will run a concurrent strategy with 10 streams, a concurrent strategy with 20 streams, and a concurrent strategy with 30 streams.
Constant Profile
Sends asynchronous requests at a fixed rate per second.
(The profile names async and constant are aliases.)
| Profile parameter | Description | Example |
|---|---|---|
rate | Requests per second; may be a list | --profile kind=constant,rate=10 or --profile '{"kind":"constant","rate":[16,32]}' |
rampup_duration | Seconds to linearly ramp from 0 to target rate | --profile kind=constant,rate=10,rampup_duration=10 |
max_concurrency | Maximum concurrent requests to schedule | --profile kind=constant,rate=10,max_concurrency=32 |
You can use the --override option to specify a list of rate values, to run a set of constant "strategies" (sub-benchmarks) with different rate values. For example, --profile kind=constant --override profile.rate 10,20,30 will run a constant strategy with 10 requests per second, a constant strategy with 20 requests per second, and a constant strategy with 30 requests per second.
Poisson Profile
Sends asynchronous requests at varying rates using a Poisson distribution around the specified target rate(s). This probabilistic pattern is useful for simulating more realistic real-world traffic patterns.
| Profile parameter | Description | Example |
|---|---|---|
rate | Target rate(s) in requests per second | --profile kind=poisson,rate=10 or --profile '{"kind":"poisson","rate":[10,20]}' |
max_concurrency | Maximum concurrent requests to schedule | --profile kind=poisson,rate=10,max_concurrency=32 |
When multiple rates are specified and a constraint with stopping_scope="all" is configured (e.g., over-saturation or error rate limits), triggering that constraint will skip all remaining rates in the list. For best results, specify rates in ascending order so that only higher (harder) rates are skipped. With non-ascending order, easier rates that follow a failed rate will also be skipped.
Use --seed kind=static,value=42 for reproducible Poisson scheduling.
You can use the --override option to specify a list of rate values, to run a set of Poisson "strategies" (sub-benchmarks) with different rate values. For example, --profile kind=poisson --override profile.rate 10,20,30 will run a Poisson strategy with 10 requests per second, a Poisson strategy with 20 requests per second, and a Poisson strategy with 30 requests per second.
Sweep Profile
The sweep profile applies a sequence of benchmark strategies to find the optimal performance points for the given model and data.
- It runs a
synchronousstrategy to measure the baseline rate, - then runs a
throughputstrategy to determine peak throughput, - and finally runs a series of asynchronous strategies with rates interpolated between the baseline and maximum throughput. (The number of interpolated strategies is
sweep_sizeminus 2.) The asynchronous strategy type is determined by thestrategy_typeprofile parameter. The default strategy type isconstant. During the async phase, if a constraint withstopping_scope="all"triggers at a given rate, remaining rates are skipped.
For example, to run a sweep with 10 strategies, 10 seconds of rampup, and a strategy type of poisson:
| Profile parameter | Description | Example |
|---|---|---|
sweep_size | Number of strategies in the sweep (including synchronous and throughput) | --profile kind=sweep,sweep_size=10 |
rampup_duration | Rate rampup duration in seconds for throughput and constant strategy steps | --profile kind=sweep,sweep_size=10,rampup_duration=10 |
strategy_type | Strategy type for interpolated steps (constant or poisson) | --profile kind=sweep,strategy_type=poisson |
max_concurrency | Maximum concurrent requests to schedule | --profile kind=sweep,max_concurrency=10 |
Replay Profile
Replays trace events using timestamps from a trace file dataset. See Trace Replay Benchmarking below for data setup.
| Profile parameter | Description | Example |
|---|---|---|
time_scale | Time scale for intervals between trace events | --profile kind=replay,time_scale=2.0 |
Wait caps and a data-side time_scale are set on --data. The profile time_scale is applied by the scheduler after those dataset timestamps are built, allowing multiple runs with different time scales.
Data Options
Synthetic Data Options
For synthetic data, use the synthetic_text data type with the desired parameters. Some key options include:
prompt_tokens: Average number of tokens for prompts (required)output_tokens: Average number of tokens for outputs (optional; omit for endpoints such as embeddings that do not produce output tokens)
For example, to benchmark with a prompt length of 100 tokens and an output length of 50 tokens:
guidellm run \
  --backend kind=openai_http,target=http://localhost:8000 \
  --data kind=synthetic_text,prompt_tokens=100,output_tokens=50 \
  --profile kind=constant,rate=5
You can customize synthetic data generation with additional parameters such as standard deviation, minimum, and maximum values. See the Datasets Synthetic data documentation for more details.
Trace Replay Benchmarking
For realistic load testing, replay trace events using each row's timestamp and token lengths. Trace data is loaded from a local file or HuggingFace dataset via a nested source config on --data, using a supported trace file format. Timestamps may be absolute or monotonic values; GuideLLM sorts them and converts them to offsets from the first event before scheduling:
{"timestamp": 1234500.0, "input_length": 256, "output_length": 128}
{"timestamp": 1234500.5, "input_length": 512, "output_length": 64}
In this example, the second request is scheduled 0.5 seconds after the first request.
Run with the replay profile:
guidellm run \
  --backend kind=openai_http,target=http://localhost:8000 \
  --data kind=trace_synthetic,source.kind=json_file,source.path=path/to/trace.jsonl,time_scale=1.0 \
  --profile kind=replay,time_scale=0.5
The data parameter time_scale acts as a scaling factor for the intervals between trace events after wait and pack caps: 1.0 preserves the original timing, 2.0 doubles the intervals and runs twice as long, and 0.5 halves the intervals and runs twice as fast. Wait caps (max_wait, max_session_wait, min_concurrent_sessions) are applied in original trace seconds before time_scale.
Raise parallelism with min_concurrent_sessions. Use copies when the packed dataset is not large enough to sustain that load for the whole benchmark. By default (copy_offset=1) copies replays the full packed trace sequentially: the next pass starts at the previous pass's last scheduled request. copy_offset can overlay or gap copies relative to that prior span. Synthetic data traces re-salt the synthetic data to ensure cache-unique conversations for the copies.
Strategically choose between increasing parallelism and affecting request timings for your use case. Higher parallelism increases concurrent simultaneous requests, and increases the chance of cache evictions affecting your benchmark.
--constraint kind=max_duration,seconds=<n> stops in-flight waits as well as new request starts. Workers sleeping until a future replay timestamp are cancelled when the duration elapses.
GuideLLM schedules trace rows in timestamp order. Use --data-loader kind=pytorch,samples=1000 to limit how many trace rows are loaded and replayed. --constraint kind=max_requests,count=1000 remains a runtime completion constraint; it does not truncate the trace dataset.
Every format by default looks for the columns "timestamp", "input_length", and "output_length". If your trace uses different column names, include timestamp_column, prompt_tokens_column, and output_tokens_column in the data config:
guidellm run \
  --backend kind=openai_http,target=http://localhost:8000 \
  --data kind=trace_synthetic,source.kind=json_file,source.path=replay.jsonl,timestamp_column=timestamp,prompt_tokens_column=input_length,output_tokens_column=output_length \
  --profile kind=replay
This functionality extends to columns required by specific formats. These additional columns and other format-specific arguments are described in the Trace File Formats documentation
Working with Real Data
While synthetic data is convenient for quick tests, you can benchmark with real-world data:
guidellm run \
  --backend kind=openai_http,target=http://localhost:8000 \
  --data kind=json_file,path=/path/to/your/dataset.json \
  --profile kind=constant,rate=5
You can also use datasets from HuggingFace:
guidellm run \
  --backend kind=openai_http,target=http://localhost:8000 \
  --data kind=huggingface,source=garage-bAInd/Open-Platypus \
  --profile kind=constant,rate=5
Output Options
By default, benchmark results are saved to benchmarks.json and benchmarks.csv. Specifying --output replaces this default selection. See output configuration for examples of selecting formats and configuring file outputs for default directories and custom paths.
Progress logging
Benchmark progress is logged automatically at INFO, including in non-interactive shells. No extra progress options are needed. Each strategy logs its start, periodic statistics (at most once every ten seconds during updates), and completion. Records include elapsed time, successful/errored/incomplete request counts, and request/output-token throughput. Updates depend on scheduler callbacks and are not an independent heartbeat during a stall.
Rich progress continues to work alongside logging. --disable-console and --disable-console-interactive control displays, not logging. Existing logger levels control which records are emitted. To redirect only logs, use 2>progress.log; to retain structured file logs, configure GUIDELLM__LOGGING__LOG_FILE_LEVEL=INFO and GUIDELLM__LOGGING__LOG_FILE=progress.jsonl.
Authentication
When benchmarking against servers that require authentication (such as OpenAI's API), provide an API key in the backend configuration. See the API Key Configuration section in the Backends documentation for details.
Troubleshooting
See the Troubleshooting guide for common issues.